Debug Automation Workflows
Debugging validates node configuration, variables, connections, and page actions in the current editor. After debugging succeeds, save the workflow and create a formal task to reduce the impact of batch execution.
Browser automation depends on the ZYBrowser desktop client, local executor, and local communication service. It cannot run independently in an ordinary web page.
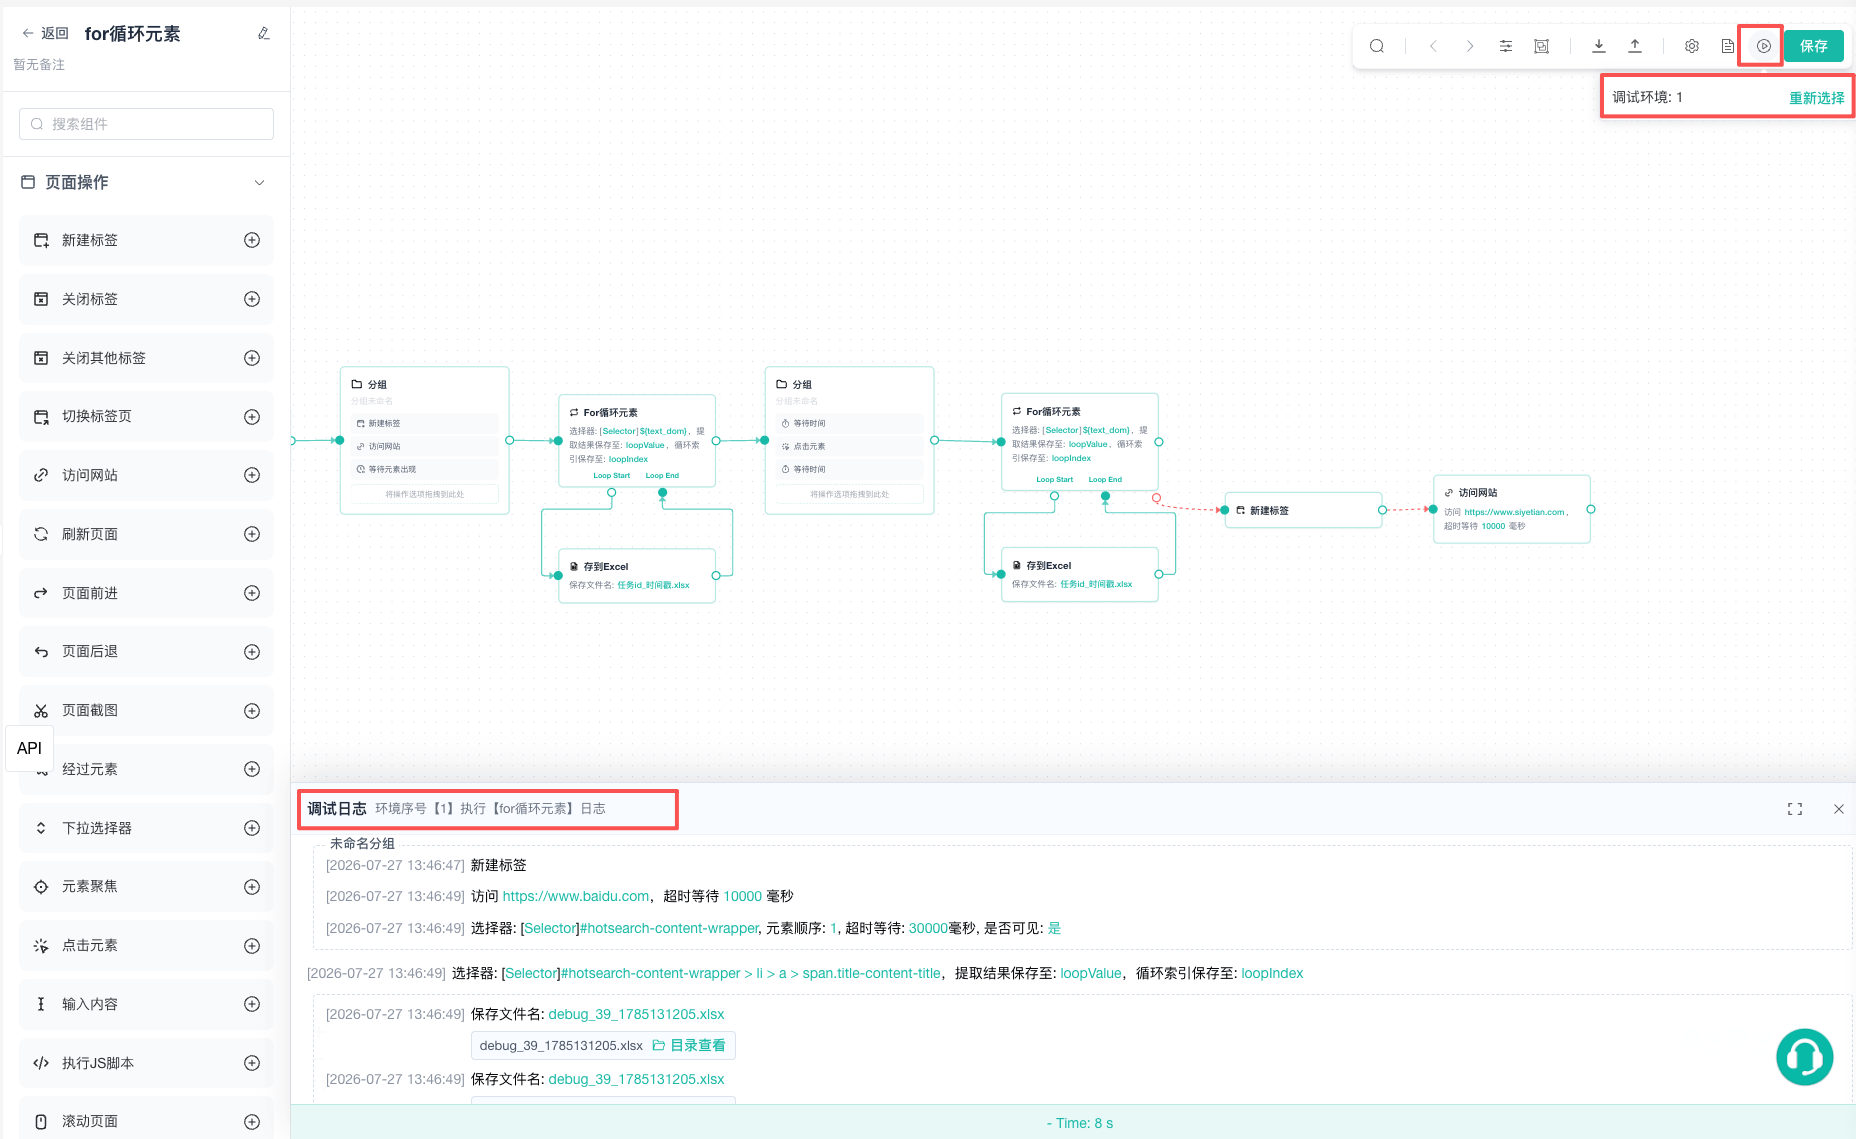
Before Debugging
Confirm that:
- The ZYBrowser desktop client and local service are running.
- Required node fields are configured.
- Nodes form a valid executable path from Start.
- The page URL, test account, and test data are available.
- At least one profile uses an engine supported by the current platform.
Use an isolated test profile for workflows that submit forms, modify business data, upload files, or clear cookies.
Select a Debug Profile
The first Debug click opens profile selection. Search by profile name or notes and paginate the list.
A debug profile must:
- Use an engine version of at least
118. - Use an engine supported by the current operating system.
Ineligible profiles are disabled. If none are available and the account has permission, use the prompt to create a profile. See Launch and Maintain Browser Profiles for runtime status.
The selected profile remains in the current editing session. To use another account, cookie, or proxy context, select another profile from the Debug prompt.
When a profile is already running, RPA tries to reuse the existing connection and prepares a new runtime only when reuse fails. Closing profiles before every debug is not required.
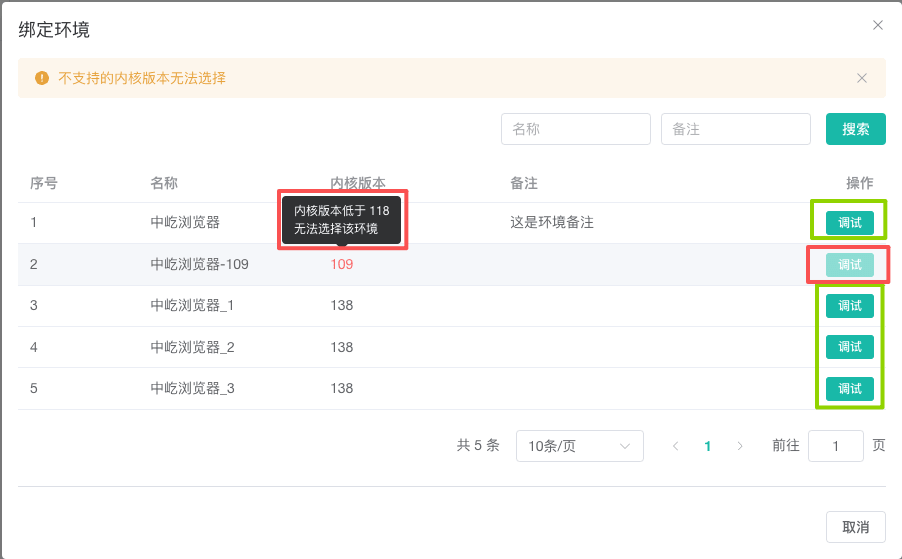
| Visual state | Meaning | Action |
|---|---|---|
| Green | Engine is at least 118 and supported on the current platform | Select and debug |
| Red | Engine or platform requirement is not met | Use or create a compatible profile |
Debug the Complete Workflow
- Configure nodes and connections in the editor.
- Click Debug on the toolbar.
- Select a compatible profile on the first run.
- Wait for validation and observe browser execution.
- Open Debug Logs to review each node.
Before running, the editor validates node fields and graph structure and injects system variables into Start. Errors highlight and focus the relevant nodes instead of starting execution.
System variables include task, profile, assigned account, and cookie information. Accounts and cookies are sensitive; do not print them from test scripts or log text.
Debug from a Specific Node
The floating toolbar on an ordinary node provides Debug from Here. Use it to recheck a later path or one page action.
This mode:
- Validates the selected node and its reachable downstream path only.
- Does not execute ordinary nodes before it.
- Does not create their output variables.
- Still injects global variables from Start.
When the target depends on login, navigation, or an upstream output, debug from an earlier node that establishes the state or prepare the state in a test profile.
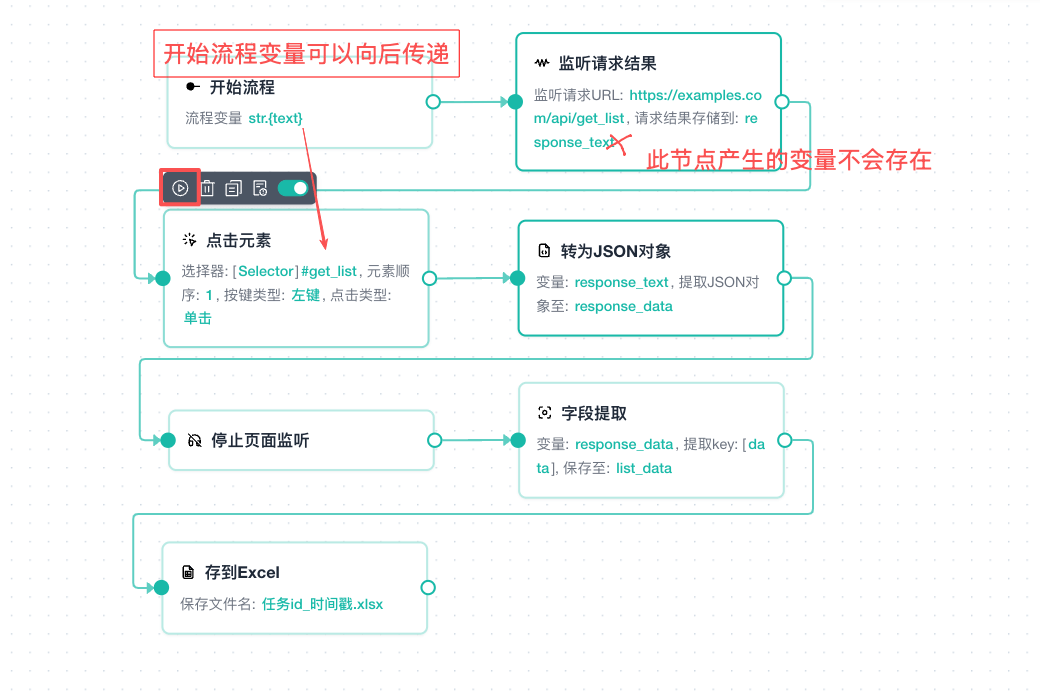
| Marker | Meaning |
|---|---|
| Click Element node | The selected node and reachable downstream path are validated and executed |
| X icon | Ordinary nodes before the selected node do not run or produce output variables |
| Start arrow | Global variables from Start are still injected |
Stop Debugging
During a debug run, Debug changes to Stop. Clicking it sends a stop request to the local executor.
After sending the request, wait for the executor to report the final stopped state. Do not click repeatedly or assume that the run has fully stopped while the button is processing.
Review Debug Logs
The log drawer shows the active or most recent run:
- Node messages in execution order.
- Full-screen view.
- Automatic scrolling to the newest message.
- The local log directory.
Ordinary nodes display their messages. Loops, IF, groups, and error branches use structured containers that expand to show nested nodes instead of a flat list.
Start at the first error or timeout. Later errors can be cascading results of a missing page state or variable in an earlier node.
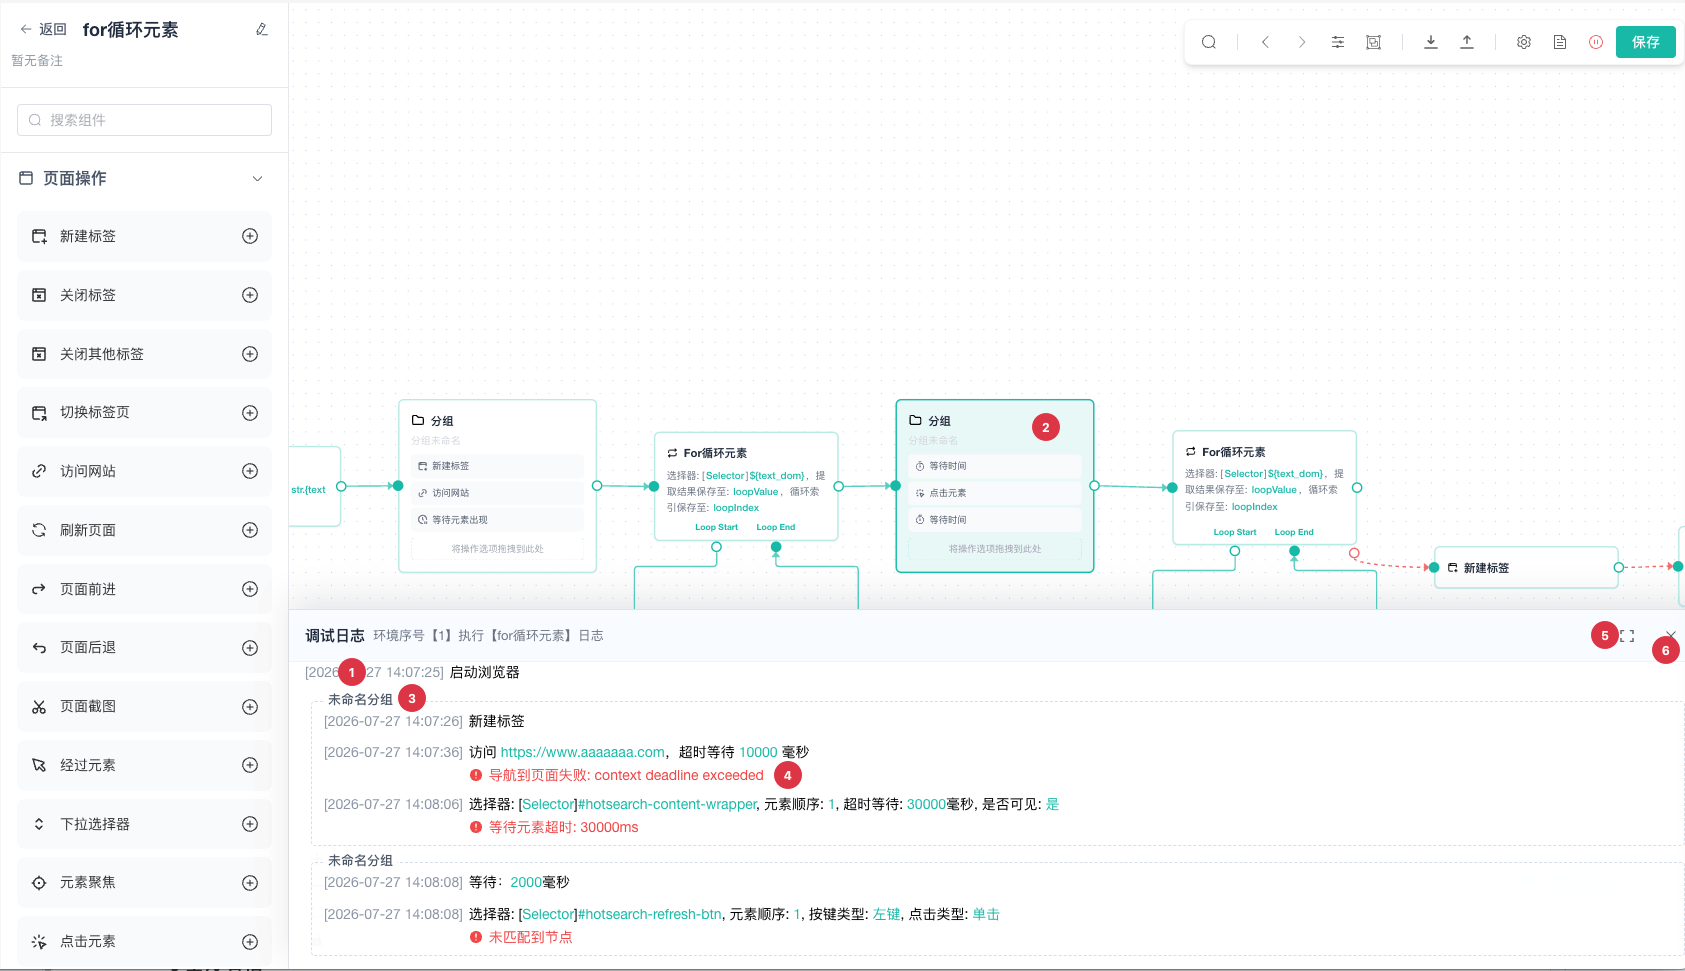
| No. | Location | Description |
|---|---|---|
| 1 | Time and node name/summary | Verify actual order and content by time |
| 2 | Active node | Highlights the node currently executing |
| 3 | Group, loop, IF, and For blocks | Displays structured execution content |
| 4 | Error | Reports an exception during node execution |
| 5 | Full-screen | Displays the complete log in a full-screen view |
| 6 | Close log drawer | Closes the drawer |
Diagnose Validation Errors
Before debugging, validation checks:
- Required node fields.
- Variable names and formats.
- Start and reachable paths.
- IF
TrueandFalsebranches. - Loop
Loop Start,Loop End, and back edges. - Invalid multiple inputs on standard nodes.
- Outputs from terminal nodes such as Close Profile.
Fix the first focused error and debug again. See Resolve Validation Errors for graph rules.
Diagnose Runtime Errors
Page Element Not Found
Confirm the correct tab, page load, and selector. Add Wait for Element or replace the location with a more stable CSS selector, XPath, or attribute.
Variable Has No Value
Confirm that the source node ran and the active node is downstream. Debugging from an intermediate node does not create upstream ordinary-node outputs.
Debug Profile Cannot Be Selected
Check for an engine below 118 or an unsupported platform. Create or select a compatible profile.
Still Running After Stop
Wait for the executor's stop event. If it remains unchanged, check the desktop client and local communication service, then inspect local logs.
Local File Node Fails
Confirm that the file or directory exists and the client has read/write permission on the execution computer. Absolute paths usually require reselecting after migration.
After Debugging
- Correct the discovered problems.
- Press
Ctrl/Cmd + Sto save and remain in the editor, or click Save to return. - Debug critical paths again.
- Create or update the formal task under Task Management.
Formal tasks use the saved workflow. Unsaved editor changes are not a reliable task version.
Related Guides
- Use the Workflow Editor: Learn validation, error branches, and node debugging.
- Element Location and Selectors: Resolve page location failures.
- Task Management and Scheduling: Bind a workflow to formal profiles.
- Run History: Review formal task logs.